SaaS dashboard
Predicted
A dashboard that helps restaurants track sales, plan stock and waste less food.
- Client
- Predicted
- Users
- Restaurant owners and the admin team
- Deliverables
- Dashboard UI, design kit, billing and plans, auth
- Screens
- Admin portal, restaurant portal, settings, billing, login, sign up
Overview
Forecasts, alerts and waste tracking.
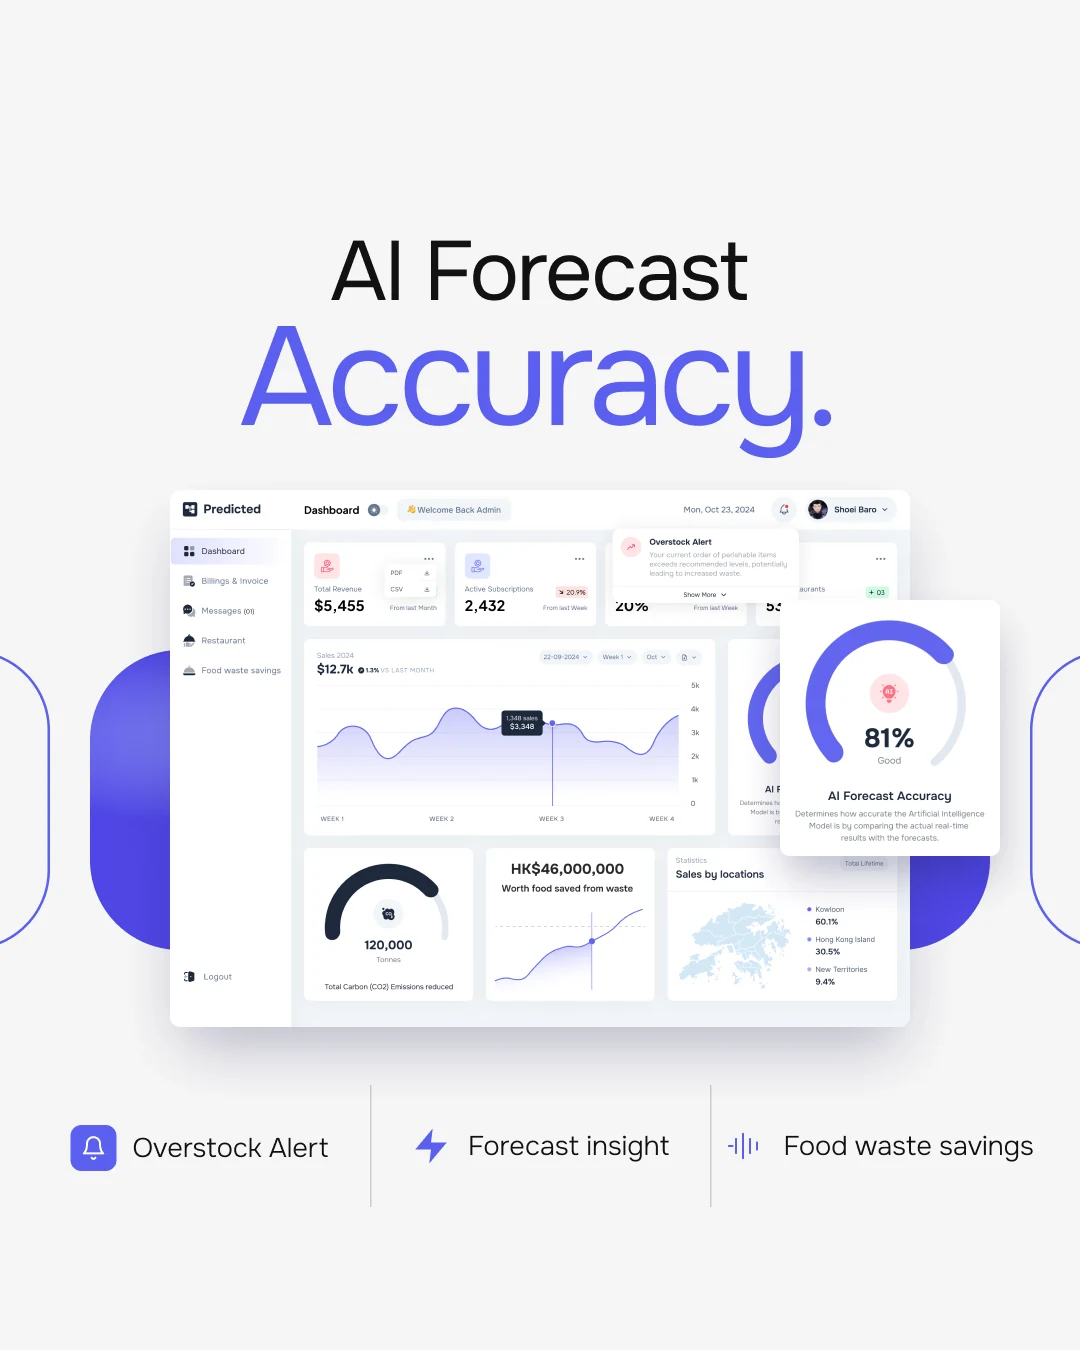
Predicted is an inventory system for restaurants. It forecasts sales with AI and warns about overstocked perishables.
I designed the admin portal and the restaurant portal (Starter and Premium), plus billing, settings, sign-in and a design kit.
The challenge
Two audiences, one data set, spoiling food.
- 01Owners and admins need different views of the same numbers.
- 02An overstock warning must show before the order.
- 03Savings had to read as items, money and CO2.
The approach
One layout, two portals, alerts up front.
- 01Both portals share one sidebar layout.
- 02Alerts drop from the bell, above the first numbers.
- 03The waste page has a table, a trend chart and a gauge.
Structure
Two portals, one system.
Page structure from both portal sidebars.
Predicted
- Sign inLoginSign up
- Admin portalDashboardBillings & InvoiceMessagesRestaurantFood waste savings
- Restaurant portalDashboardInventoryForecast insightFood waste savings
- BillingPlansAdd paymentInvoicesCancel plan
- SettingsAccount settings
Key screen
The admin dashboard.
Every morning number in one view.
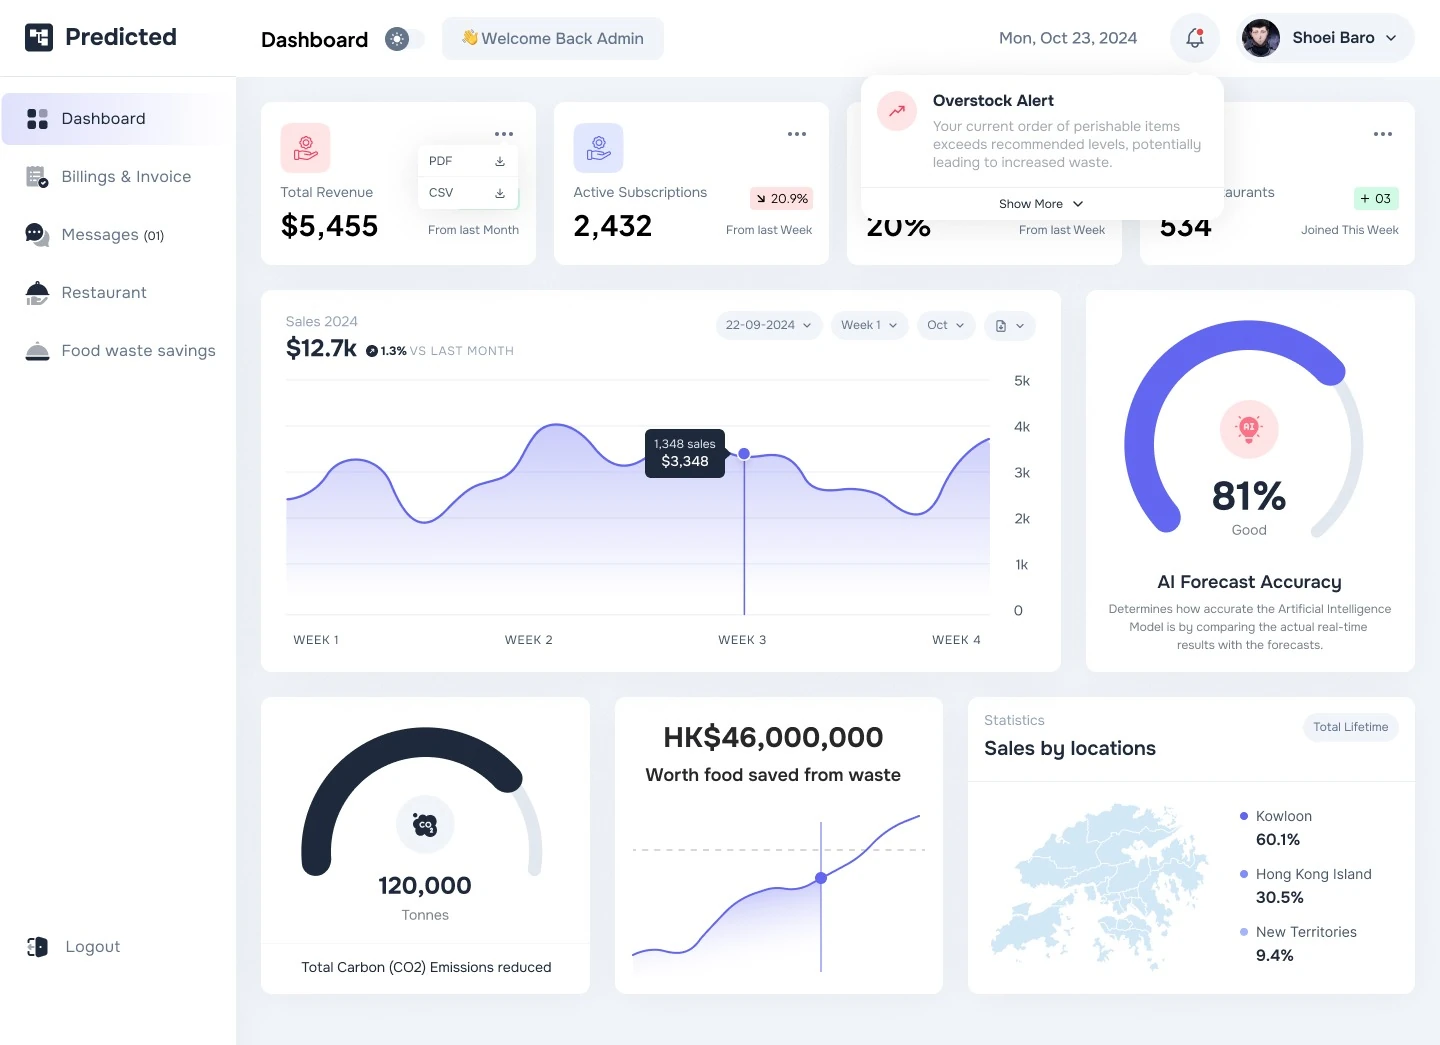
- 1Export in one click
Each KPI card downloads its data as PDF or CSV.
- 2Trend at a glance
Chips show change since last week or month.
- 3Overstock alert
Orders above the recommended level raise an alert.
- 4Sales curve
Weekly sales with a tooltip and date filters.
- 5AI forecast accuracy
A gauge compares real sales with the forecast.
- 6Sales by location
A district map splits lifetime sales.
Key screen
Food waste savings.
Waste becomes items, money and CO2.
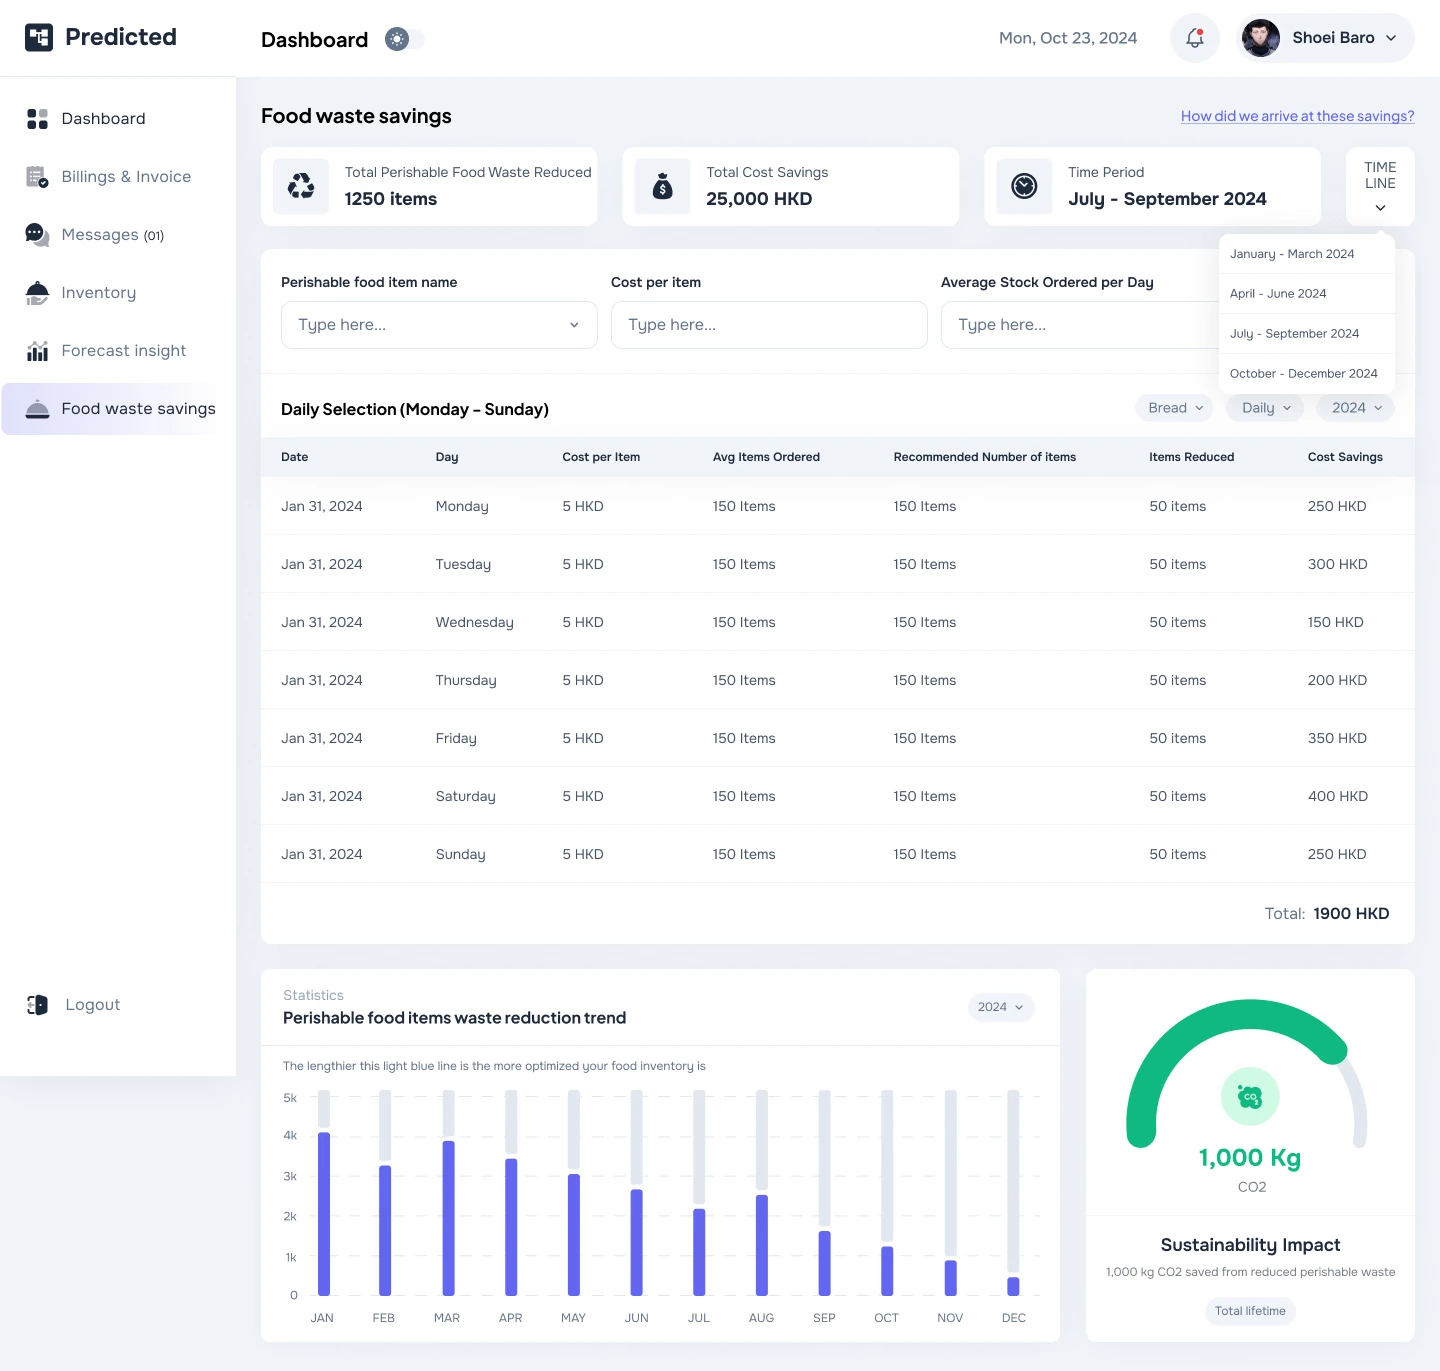
- 1Summary first
Items reduced, cost saved and period lead the page.
- 2Quarter picker
A menu switches between quarters.
- 3Item lookup
Filter by item, cost and average stock ordered.
- 4Daily selection
Ordered, recommended and reduced amounts, with daily savings.
- 5Reduction trend
Monthly bars show waste falling.
- 6Sustainability impact
A gauge turns savings into kilograms of CO2.
Visual language
Calm surfaces, one strong accent.
Indigo is for actions and data. Green and red carry meaning.
- Indigo
#6366F1 - Slate 800
#1E293B - Slate 500
#64748B - Slate 100
#F1F5F9 - Emerald
#10B981 - Red
#EF4444 - Orange
#F97316
Typography
Primary typeface
Aa 81%
Onest
Used across every screen for numbers, labels and body text.
- Regular
- Medium
- SemiBold
- Bold
Secondary typeface
$12.7k
Plus Jakarta Sans
Used alongside Onest in parts of the interface.
- Regular
- Medium
- Bold
Final screens
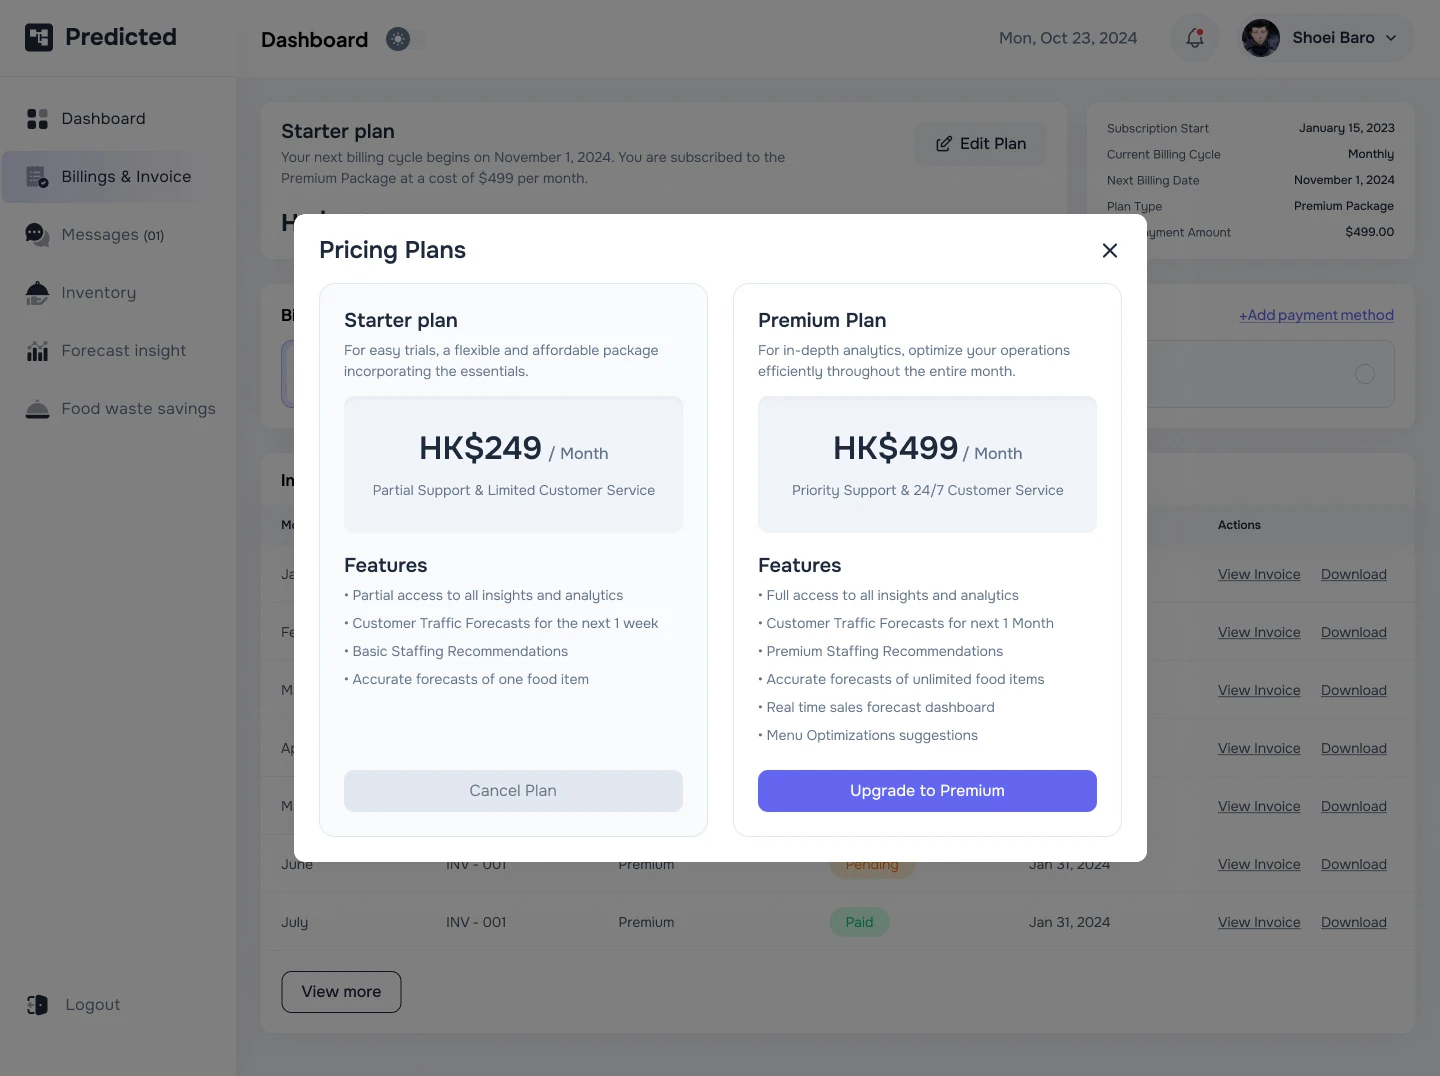
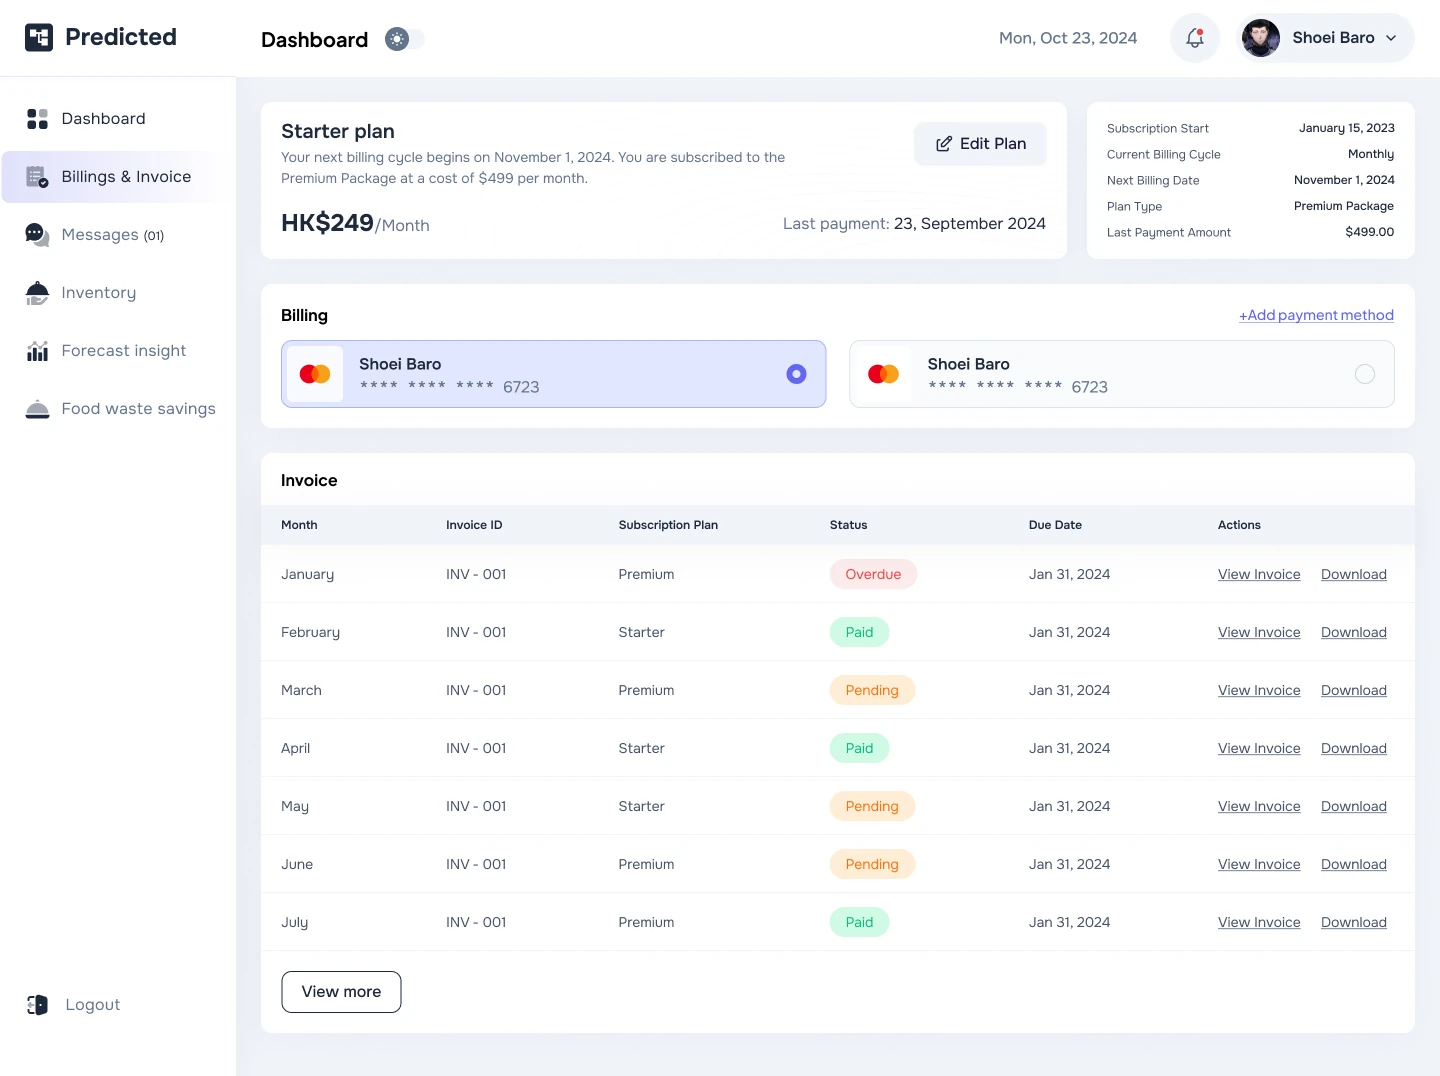
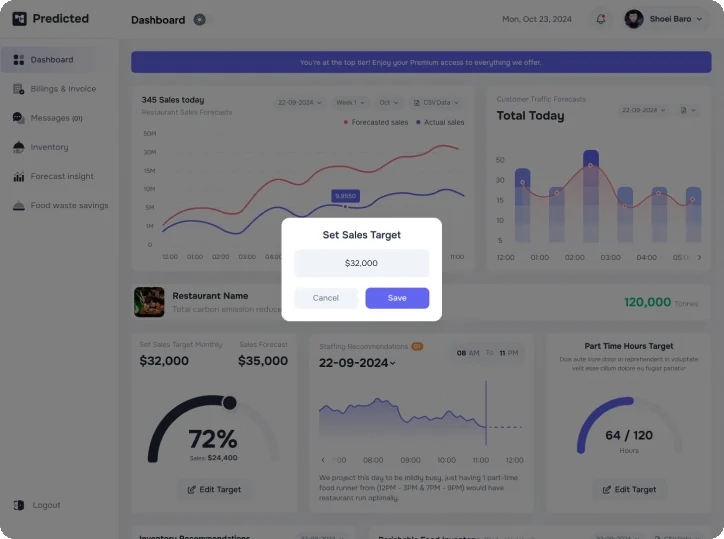
Billing, plans and the restaurant portal.
Owners compare plans, change payment methods and get invoices.
Deliverables
What I delivered.
- Admin portal
- Restaurant portal
- Starter and Premium plans
- Billing and invoices
- Food waste savings
- Settings
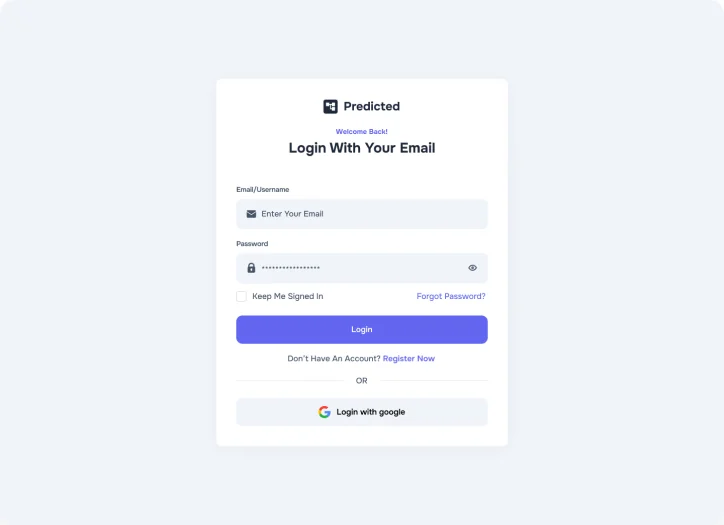
- Login and sign up
- Design kit
Want this kind of clarity for your SaaS dashboard?
Book a free 30 minute call. You leave with 3 written fixes, even if we don’t work together.
 Nafees ZulfiqarUsually replies within an hour
5.0 from 33 Upwork reviewsTop Rated