Guide
SaaS dashboard design examples, explained.
Four dashboard screens I designed for two real SaaS products, with what each part of the screen does and why it is there.
5.0 from 33 Upwork reviews · Top Rated · 100% Job Success
Why these examples are different
Most dashboard galleries show beautiful screens with no context. You see the colours, but not the problem the screen solves. The examples below come from two client products I designed: Office Vibe, an employee engagement product, and Predicted, an inventory system for restaurants. For each screen, I explain what every part does, so you can borrow the thinking and not only the look.
Example 1: a survey report that leads with one score
Office Vibe helps companies listen to their people through pulse surveys, feedback, goals and 1-on-1s. Each survey produces scores, trends and dozens of results, and a manager has little time to read them. So the Pulse Survey Report opens with one number and puts the detail below it.
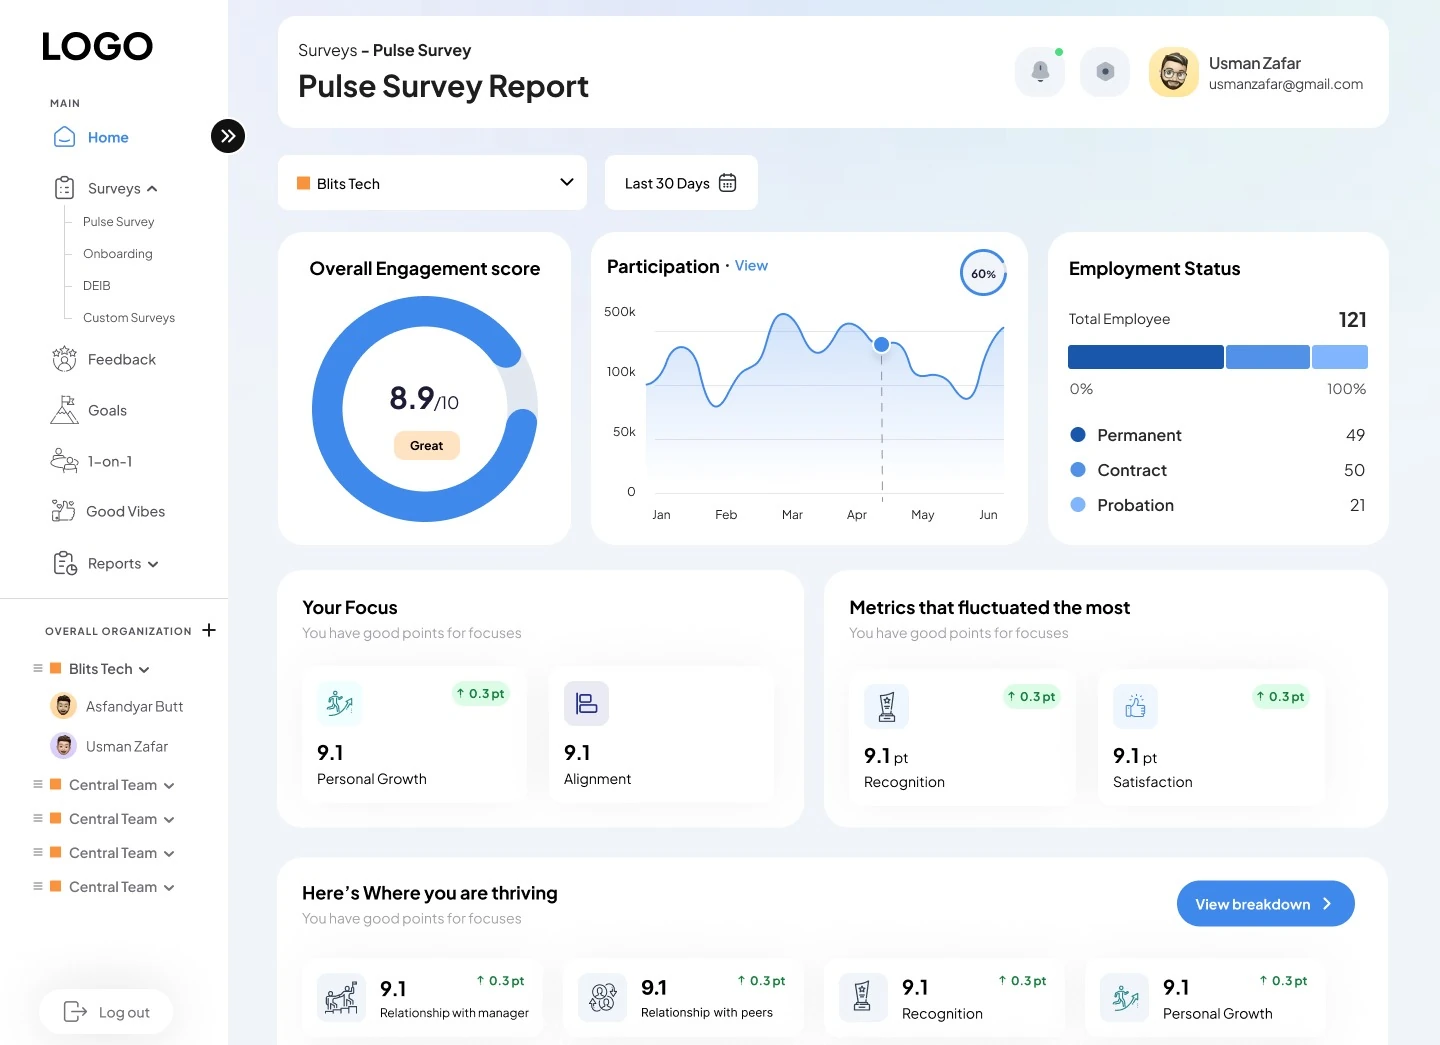
- Scope filters: organization and date range filters sit above every report.
- Engagement score: 8.9 out of 10 in a donut, labelled Great, so the answer comes before the detail.
- Participation trend: a monthly curve with a hover point and a View link.
- Employment status: 121 employees split into permanent, contract and probation.
- Your focus: key metrics with point change chips.
- Where you are thriving: ten metric cards and a View breakdown button.
The lesson: decide the one question the screen answers, put that answer first, and keep the detail one click away.
Example 2: a social feature inside a data product
Good Vibes is Office Vibe's recognition module, where teammates send each other cards. It had to feel warmer than the reports, but still belong to the same product.
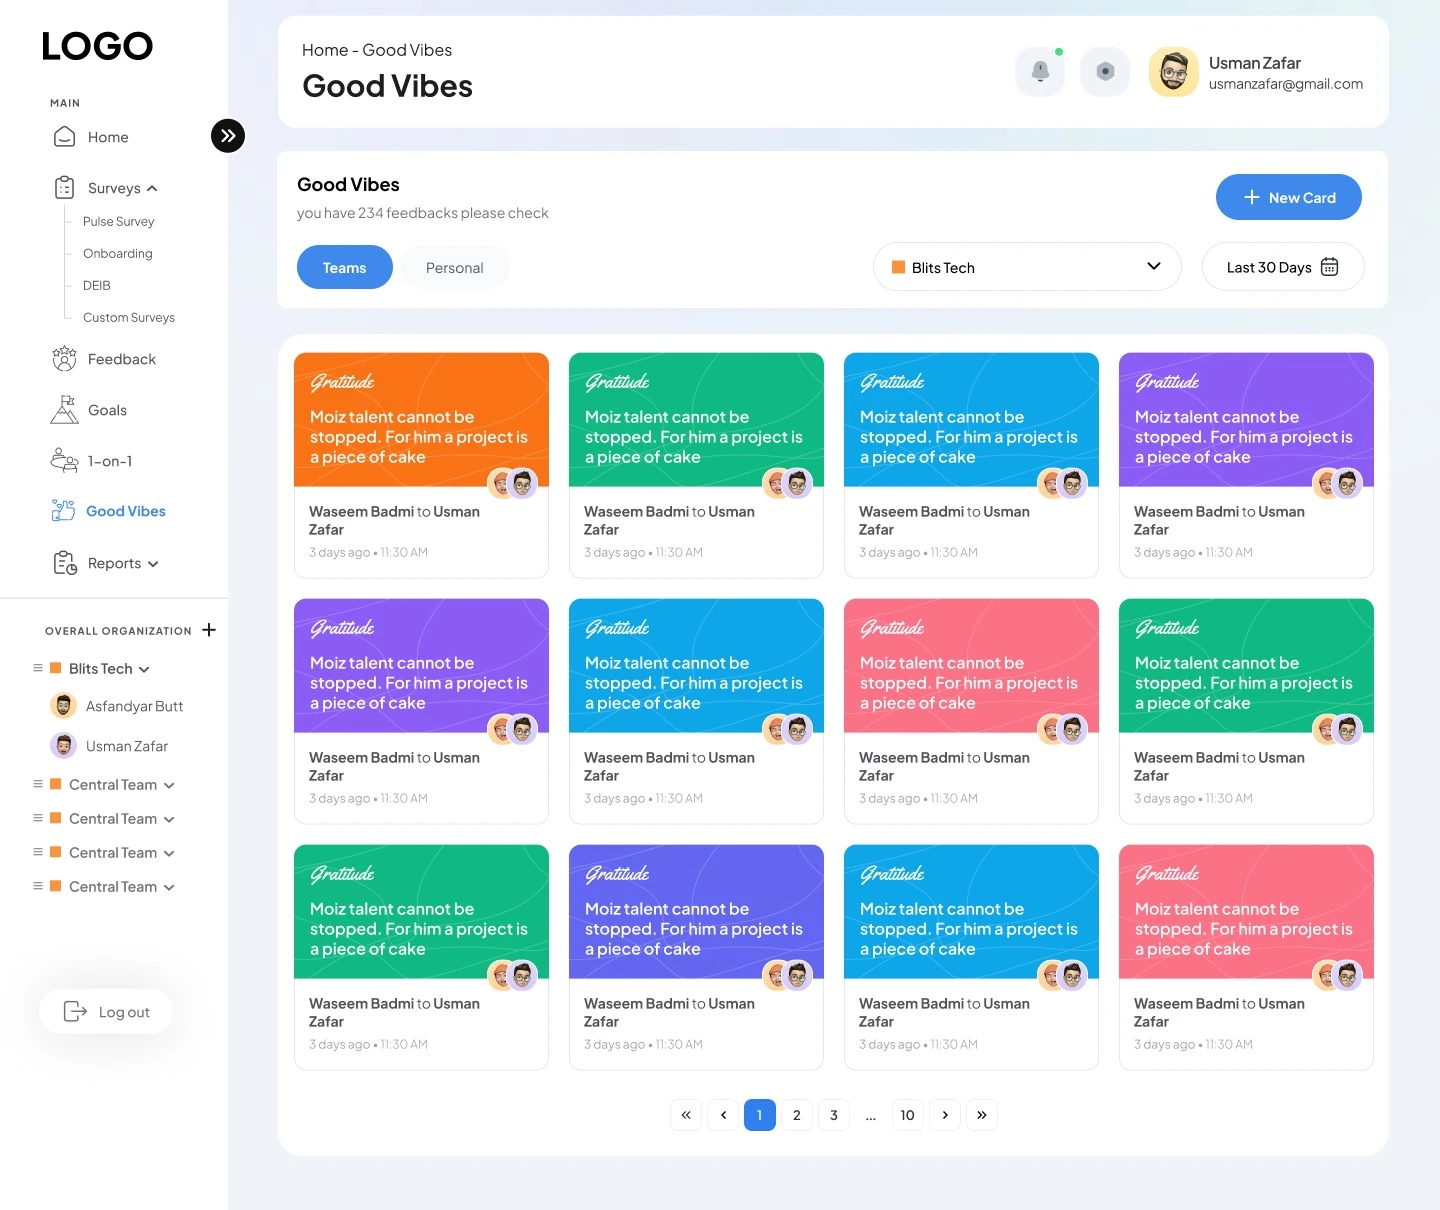
- Its own module: Good Vibes sits in the sidebar next to Feedback and Goals.
- Teams or personal: two tabs switch between team cards and your own.
- One action: a single blue New Card button sends a card.
- Card labels: each card has a colour coded label, like Gratitude.
- From and to: avatars and names show who sent it, to whom, and when.
- Paging: 234 feedbacks split across numbered pages.
The lesson: one shell, one sidebar and the same buttons let a product hold very different modules without feeling like several apps.
Example 3: a KPI dashboard with alerts up front
Predicted forecasts restaurant sales with AI and warns about overstocked perishables. Restaurant owners and the admin team look at the same numbers but need different views. The admin dashboard puts every morning number in one view.
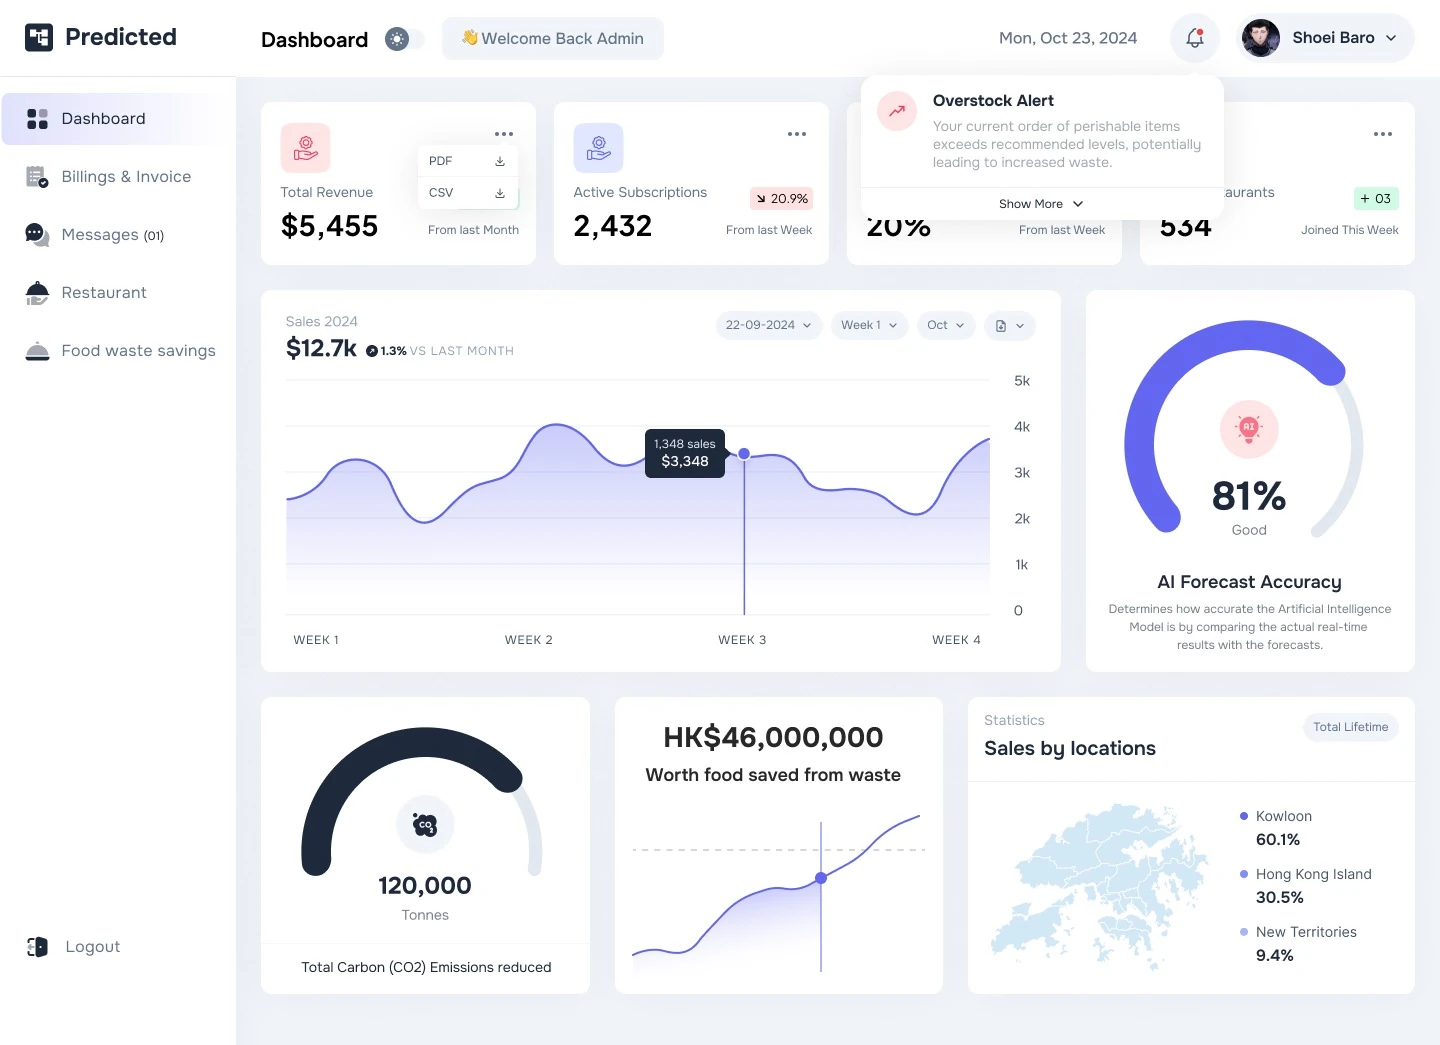
- Export in one click: each KPI card downloads its data as PDF or CSV.
- Trend at a glance: chips show change since last week or month.
- Overstock alert: orders above the recommended level raise an alert, shown above the first numbers.
- Sales curve: weekly sales with a tooltip and date filters.
- AI forecast accuracy: a gauge compares real sales with the forecast.
- Sales by location: a district map splits lifetime sales.
The lesson: a warning is only useful before the mistake. Put alerts where people look first, not in a separate page.
Example 4: turning data into a result people care about
Saving food is the reason restaurants use Predicted, so the savings had to read as something real: items, money and CO2, not only rows of stock numbers.
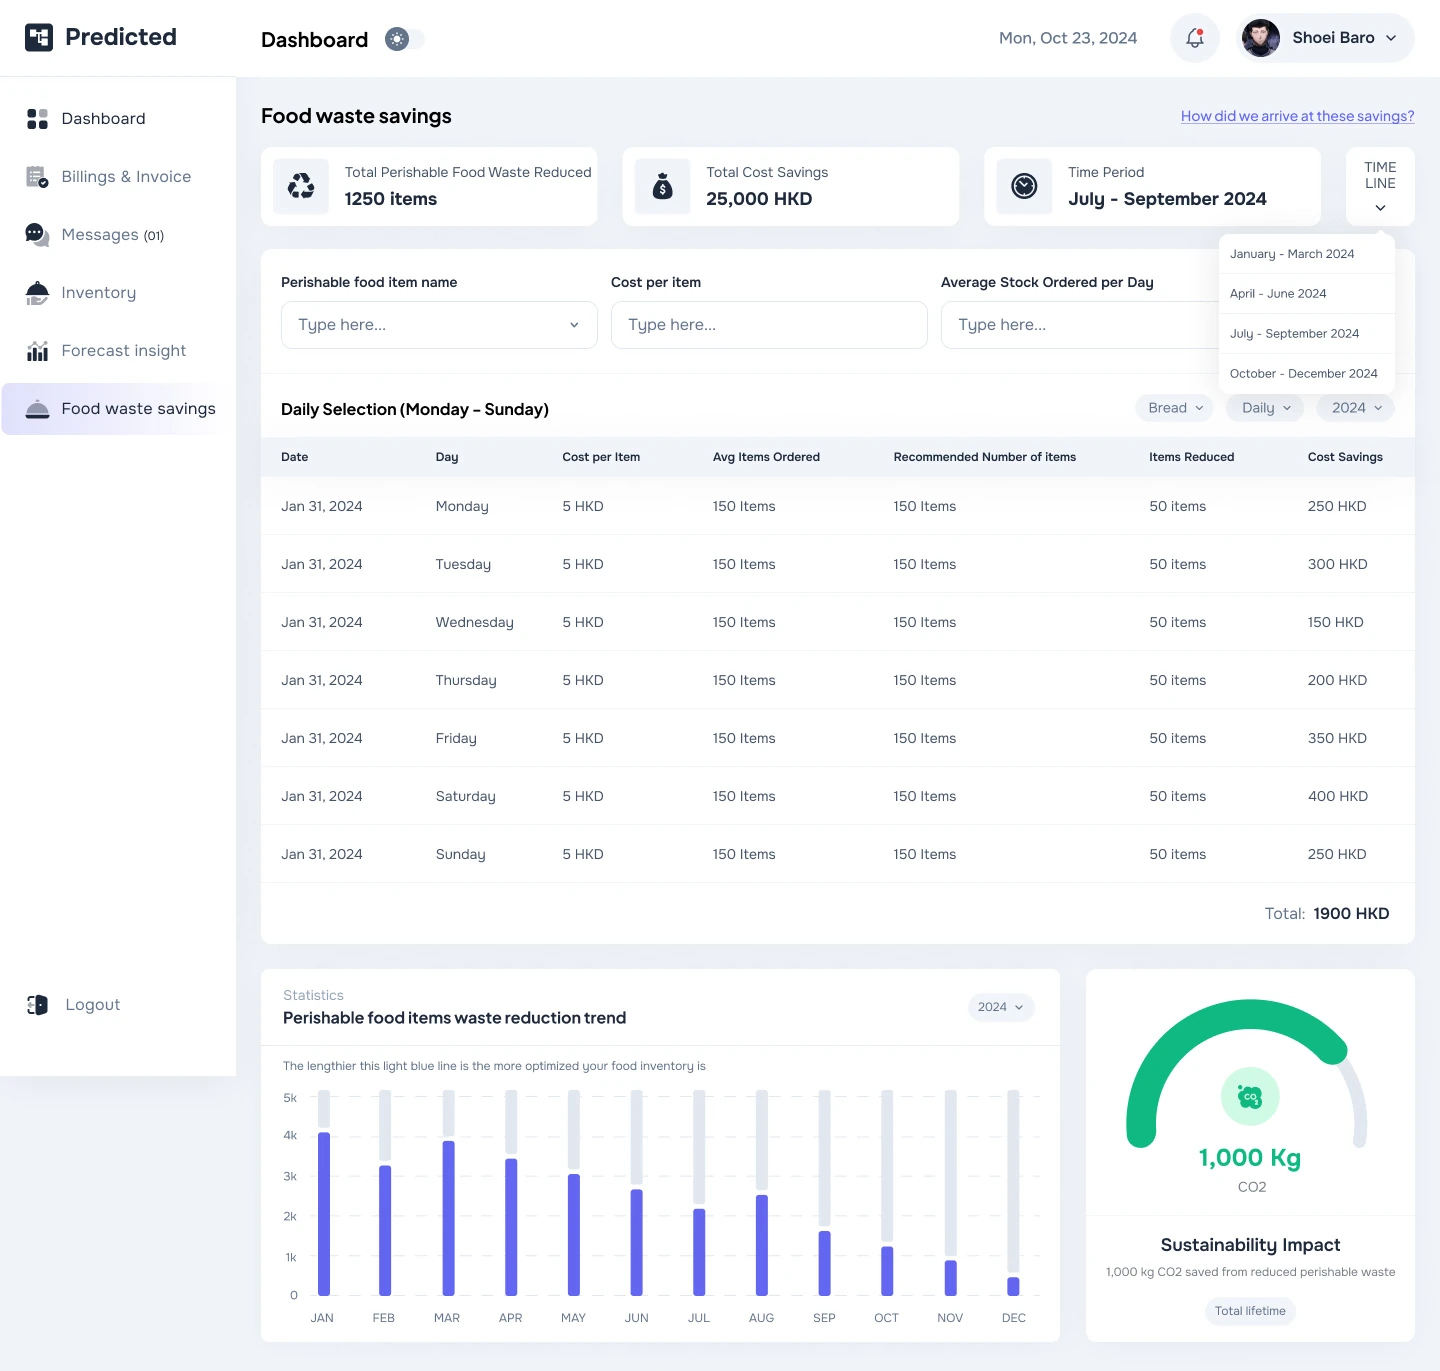
- Summary first: items reduced, cost saved and the period lead the page.
- Quarter picker: a menu switches between quarters.
- Item lookup: filter by item, cost and average stock ordered.
- Daily selection: ordered, recommended and reduced amounts, with daily savings.
- Reduction trend: monthly bars show waste falling.
- Sustainability impact: a gauge turns savings into kilograms of CO2.
The lesson: show the outcome in the units your customer cares about, then give them the table to check it.
What these dashboards have in common
- The answer comes first. One score, one summary or one alert at the top. The detail is one click away.
- One shell for everything. Office Vibe has eight modules under one sidebar. Predicted has two portals with the same layout. People learn the layout once.
- Repeated parts. The same cards, filters and buttons appear on every screen, so nothing needs explaining twice.
- Colour with a job. In Predicted, indigo is for actions and data, while green and red carry meaning. In Office Vibe, blue is for actions and data and orange marks teams and highlights.
See the full projects
Each case study shows the structure, more screens and the reasoning behind them: Office Vibe has over 40 desktop screens, from reports and builders to settings and permissions, and Predicted covers the admin portal, the restaurant portal, billing and a design kit.
If your product needs a dashboard people understand in minutes, see my SaaS dashboard design services. Not sure what is wrong with the one you have? A UX audit finds the problems first.
FAQ
Questions about dashboard design.
What should a SaaS dashboard show first?
The answer to the main question the user comes with: a score, a summary or an alert. Details, breakdowns and tables go below it or one click away.
How do you design one dashboard for two types of users?
Keep one layout and one set of components, then change what each role sees. Predicted has an admin portal and a restaurant portal that share the same sidebar layout.
Where should alerts go on a dashboard?
Where people look first, before they act. In Predicted, the overstock alert shows above the first numbers, so a restaurant sees it before placing an order.
Are these real projects or concepts?
They are client projects. The case studies on this site show more screens from each one.
Can you redesign an existing dashboard?
Yes. Many projects start with the area that hurts most, such as the main dashboard or onboarding, and continue from there.
Want a fixed price for your product?
Book a free 30 minute call. You leave with 3 written fixes, even if we don’t work together.
 Nafees ZulfiqarUsually replies within an hour
5.0 from 33 Upwork reviewsTop Rated